http://dx.doi.org/10.15198/seeci.2017.43.99-114
RESEARCH
IMPORTANCE OF THE FREQUENCY DISTRIBUTION OF CONTACTS IN MEDIA PLANNINGIMPORTANCIA DE LA DISTRIBUCIÓN DE FRECUENCIAS DE CONTACTO EN PLANIFICACIÓN DE MEDIOS
Vicente Badenes i Pla1
Aurora García González2
1University of Vigo. España. vbadenes@uvigo.es
2University of Vigo. España a auroragg@uvigo.es
1Vicente Badenes i Pla: Managing Director of Ingeniomedia (Grupo Zertem) and teaches at the Faculty of Social Sciences and Communication at the University of Vigo, as Associate Professor vbadenes@uvigo.es
Received: 20/03/2017
Accepted: 03/05/2017
ABSTRACT
GRPs, Coverage and OTS are three key concepts present in any media planning. They represent the unit of measure in the advertising market, the benchmark that allows determining the extent to which the objectives set out in a media planning have been met. It would be highly recommended to join these indicators with a distribution of contact frequencies that allows us to know in greater depth the reality of the results obtained. Through the dissection of the results obtained by a frequency distribution, this article reviews the importance and usefulness of this simple statistical grouping of data.
KEY WORDS: Marketing, media planning, frequency of contacts
RESUMEN
GRPs, Cobertura y OTS son tres conceptos clave presentes en toda planificación de medios. Representan la unidad de medida en el mercado publicitario, el referente que permite determinar en qué medida se han cumplido los objetivos establecidos en un plan de medios. Sería muy recomendable acompañar estos indicadores con una distribución de frecuencias de contacto que permita conocer con mayor profundidad la realidad de los resultados obtenidos. A través de la disección de los resultados obtenidos por una distribución de frecuencias, en este artículo se revisa la importancia y utilidad de esta sencilla agrupación estadística de datos.
PALABRAS CLAVE: Marketing, planificación de medios, frecuencias de contacto
How to cite this article
Badenes i Pla, V., García González, A. Importance of the frequency distribution of contacts in media planning [Importancia de la distribución de frecuencias de contacto en planificación de medios] Revista de comunicación de la SEECI, 43, 99-114.
doi: http://dx.doi.org/10.15198/seeci.2017.43.99-114
Recuperado de http://www.seeci.net/revista/index.php/seeci/article/view/460
1. INTRODUCTION
GRPs, Coverage and OTS are three key concepts present in any media planning and that allow us to estimate the efficiency obtained in relation to predefined scope, frequency and advertising pressure objectives. They represent the unit of measure in the advertising market that allows us to determine to what extent the objectives established in a media plan have been fulfilled. It would be highly recommended to always accompany these indicators with a distribution of contact frequencies that allows us to know in greater depth the reality of the results obtained. Through the dissection of the results obtained by a frequency distribution, this article reviews the importance and usefulness of this simple statistical grouping of data. In a business such as advertising where, increasingly, and especially with the advent of the digital world, transparency and clear indicators of the return obtained are demanded by the advertising brands, the distribution of contact frequencies appears as a simple tool to show, in a detailed, objective and easily understandable way, the reality of the results obtained by media planning beyond gross indicators (GRP) or mean indicators (OTS).
2. OBJECTIVES
Starting with a real case, simple in its scheme but extrapolable to other more complex assumptions, the article has a didactic objective for those who start in media planning, but it is also intended to serve as a reflection for those professionals (especially advertisers) that either by inertia, comfort or mere ignorance, make decisions of great relevance to their communication budgets based on indicators that certainly demand a more accurate reading and interpretation to know the reality behind them more deeply.
3. STATE OF THE ART
3.1 Definition and introduction to key indicators
First, it is necessary to determine what is meant by KPI or key performance indicator. To Parmenter, KPIs represent a set of measures focusing on those aspects of organizational performance that are the most critical for the current and future success of the organization (Parmenter, 2010, p.4-6). They are therefore determinant indicators for the future of the organization that fulfill a series of characteristics:
• They are non-financial indicators, not measured in Euros or dollars.
• They are frequently measured
• They are backed by top management
• They indicate a clear direction in the measures to be taken and are understandable to the one who should implement them
• They have a significant impact
• They encourage appropriate actions
Both coverage and the OTS resulting from both, GRPs are the key performance indicators in media planning and meet each and every one of the requirements set by Parmenter. All three are non-financial measures that offer a diagnosis of the effectiveness of advertising communication, a critical aspect of organization, as it determines whether branded messages reach the audience, and especially a certain percentage of the target group (coverage), the appropriate number of times (frequency) to be perceived (awareness) and achieve some kind of impact.
The following is a brief definition of the main concepts involved in the process in order to contextualize the actors and processes involved in the achievement of the three KPIs involved in a distribution of contact frequencies.
• Target Group or Target audience: The group of people targeted specifically by the communication of the advertising brand. All those people who meet the characteristics (sociodemographic, attitudinal, behavioral) defined beforehand belong to the group.
• Audience: A group of individuals who come into contact with a medium or support in a given period of time.
• Rating Point / RP: A rate that serves to measure the audience of a support on our target. It represents the percentage of average audience of a medium or support.
• Coverage: The percentage of our target audience that is reached by our campaign at least once, not including duplications.
• Gross Rating Point (GRP): This is a numerical rate, the gross total sum of the audience percentages (or ratings) for each of the media plan insertions.
• Frequency (OTS): From the acronym in English. Opportunity to See. Average opportunity of the times the target has been exposed to the brand message.
• Effectiveness in communication: communicative effectiveness would be determined by the degree of fulfillment of communication objectives, which would generally lie in its capacity to generate a favorable response to whoever issues the communication. The objectives are the pillars on which efficiency measurement is based (Beerli, A., Martín, J.D, 1999, p22), and thus determine success or failure in their fulfillment. In a first stage, effectiveness is concretized in notoriety, that is, that a certain percentage of the target has seen, read or heard the issued campaign and remembers some aspect of it.
Coverage would determine the initial and minimum threshold of communicative effectiveness, notoriety, since it clearly differentiates between those contacted, even if only once, and those not contacted. For any individual who does not receive any impact, the campaign does not exist. Based on the premise of being contacted, the
contact frequency determines the number of times the campaign has been viewed. Following the usual rhetoric of advertising communication to concentrate many meanings on a powerful concept, on the one hand are the OTS that indicate the average contact frequency of the campaign and, on the other hand, the GRPs, a gross indicator that are obtained by multiplying coverage by the OTS, which goes even deeper into the issue of concentrating so much and so disparate information on a single indicator. The problem is that the information that it concentrates, although being real and useful and facilitating reading and quick comparison, does not allow us to know the form in which the contacted people have been distributed in each section of contact frequency and that a relevant data that has both communicative and economic implications. It is in this context that contact distribution acquires great relevance as a tool to provide the necessary light that allows us to know, in greater depth and detail, the behavior of a campaign, a few steps beyond the so concentrated information contributed by OTS and GRPs.
3.2 Distribution of contact frequencies
A distribution of contact frequencies or contact distribution in advertising is the response curve to the campaign which indicates the actual distribution of contacts on the individuals who have been contacted. It is the distribution of the target audience of the campaign, people, who has received 1, 2, 3, ..., n contacts. In this sense, it is understood as more appropriate, in line with what is argued by Martínez Ramos, to speak of contacts rather than of impacts. The term impact implies that advertising has produced some effect. In contrast, the word contact is merely the relationship between the individual and the support, which is understood as that place, space or time in which advertising can be included and that segments a medium into operative units (Martínez Ramos, E., 1992 ).
When media planning is carried out, a series of numbers, measures or results are usually obtained that are understandably organized to facilitate the obtaining and communication of patterns (Gravetter, F.J., Wallnau, L.B., 2014). One of the most common ways of organizing a data set is the distribution of frequencies, which as descriptive statistics simplifies the organization and presentation of data. The distribution of frequencies is also defined as an organized tabulation of the number of individuals located in each category of the measurement scale. The distribution gives us an organization in the disorder, groups the data in different classes that help the reading and panoramic vision of the results and the obtaining of tendencies that facilitate decision making. A contact distribution in media planning is a distribution of frequencies that informs us of the group of individuals impacted for different stretches of impact frequency. The distribution of frequencies always includes these two elements:
1. The set of categories that make up the measurement scale (eg Contacted)
2. The frequencies, the number of individuals in each category (eg Frequency of contact).
The distribution of frequencies provides a picture of how the individual results are
distributed in the measurement scale. In media planning, it is a very useful tool to see both the overview and the detail of the campaign results beyond their summary contributed by GRPs and OTS. Both indicators summarize the key KPIs in any planning, coverage and frequency, but as previously stated, these are average and / or gross data. They concentrate a lot of information that allows us to quickly get an idea of the results of the campaign, but beyond the immediacy of the first general diagnosis, it is also necessary to add a distribution of frequencies that allows us to know in more detail the behavior of the campaign for each stretch of the contact frequency.
The distribution of frequencies can be presented as a table or as a graph, but including both facilitates the reading and interpretation of results. The graph of a distribution of contact frequency in media planning is the curve that describes how the total coverage of a campaign is constructed based on the number of contacts received by the public, ie the cumulative frequency curve. A response curve to the campaign that indicates the actual distribution of the contacts on the individuals who have been contacted. It is the distribution of the target that has received 1, 2, 3, ..., n contacts. It is important not to confuse the frequency of contact, which is a quality that shows a habit of the audience, with the distribution of contacts, which is the end result of the action of the advertising campaign and shows the intensity with which each person has contacted the campaign (Martínez Ramos, opcit).
The number of contacts received by each member of the target is an aspect of great relevance today given the high levels of saturation of commercial stimuli that the average western citizen has to face. In an environment without saturation, maybe a single contact could be enough to achieve some type of effect. In today’s hyper-saturated environment, it is clearly insufficient. It is here that two nuances of the two pillars of media planning become relevant: effective coverage and effective frequency. The addition of the effective adjective is an assumption of the fact that the minimum threshold of a contact is clearly insufficient.
Effective coverage represents the percentage of the audience that has been impacted by a certain effective frequency level that ensures reception / understanding of the message. It is a question of establishing the minimum number of times the campaign has to be viewed in order to have a minimum effect. Contact levels below that threshold would be insufficient and therefore inefficient. An effective coverage threshold corresponds to each effective frequency level. And all this to try to give an answer to the great question that the discipline of media planning asks since its origins: how many times must the campaign be seen / read / heard to be effective? When is it enough, either more or less? Still today, in the 21st century and in spite of the enormous advances in data computation and econometric modeling, there is no clear consensus on the number of contacts (effective frequency) needed to determine the effectiveness of communication (Sissors, J., Baron, R.B., 2008). The answer is still dependent, because it is a reality that depends on many factors.
3.3. Description of the case being analyzed
We are going to proceed to analyze a very simple assumption, based on a real case, but adapted in some nuances for didactic purposes and omitting the brand that lies behind for confidentiality purposes. The logic of its results is perfectly extrapolated to more complex planning.
An advertising brand in the B2B (business to business) sector has done a media planning on television aimed at a target group quantified as 34,218 people. The television campaign consists of 12 spots of the same creativity to be broadcast on the television network TTT.
Once issued, subsequent measurements determine that the campaign has been seen, at least once, by a total of 24,783 target people. With this data, dividing the number of effectively contacted individuals (24,783) by the group of individuals that compose the campaign target (34,218), the net coverage is obtained, the percentage of the target that has seen the campaign at least once and results in 72.4%. On the other hand, in a contrary sense, it can be determined that 9,435 people from the campaign target (27.6%), have not seen the campaign, have not received any impact from it. Thus, the first calculations allow us to determine results of a “Hamlet-like” order, to see or not to see the campaign, that is the question:
24,783 people from the target (34,218) see the campaign or at least at contacted once, which means a net coverage of 72.4%
9,435 people do not see the campaign, there is no impact on them, which stands for 27.6%, more than a quarter of the campaign target.
4. DISCUSSION OF RESULTS
A first general reading focused on the group of individuals who have seen the campaign allows us to observe that not all contacted people see the campaign the same number of times. Within the group of people who are members of the target group that have received at least one contact, depending on the number of times they have been contacted, they are concentrated in different groups by stretches of frequency bands. Thus, if the spots campaign has been broadcast 12 times, there will be a group of people who have seen it once, another group twice, another three times, and so on to cover the entire spectrum from 0 to 12. The absolute results of the campaign for each frequency level are as follows:
• A total of 9,435 people have not seen the campaign (= 0 contacts).
• A total of 6,424 people have seen it once (= 1 contact).
• A total of 3,798 people have seen it twice (= 2 contacts).
• A total of 3,126 people have seen it three times (= 3 contacts).
• A total of 2,907 people have seen it four times (= 4 contacts).
• A total of 2,474 people have seen it five times (= 5 contacts).
• A total of 1,984 people have seen it six times (= 6 contacts).
• A total of 3,798 people have seen it seven times (= 7 contacts).
• A total of 923 people have seen it eight times (= 8 contacts).
• A total of 865 people have seen it nine times (= 9 contacts).
• A total of 412 people have seen it ten times (= 10 contacts).
• A total of 208 people have seen it eleven times (= 11 contacts).
• A total of 197 people have seen it twelve times (= 12 contacts).
In the case described here, it turns out that there are individuals, people contacted for each stretch of contact frequency, but it could well happen that there was no person contacted for the higher frequency levels (eg, 11 or 12 times).
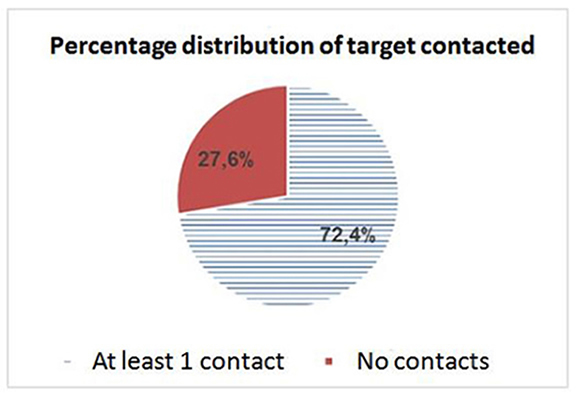
The total of all those people contacted for each frequency level constitutes the audience, the 24,783 people who meet the requirement to be contacted at least once and that in percentage represent the net coverage. In this case, it is 72.4% of the target quantified in 34,218 people. In a contrary sense, the group of members of the target that have not received any contact of the planning of spots amount to 9,435 people, 27.6% of the target. Their contact frequency is 0 and the campaign does not exist to them.
Figure 1 shows in a pie chart the percentage distribution of contacted (audience) and not contacted, which allows us in a visual and summarized way to get a clear idea of the proportions of each magnitude.
Figure 1. Percentage of contacted and not contacted. Source: Made by the author
With this data, with the number of contacts in each frequency level, the advertising pressure obtained by the spots planning can already be calculated. The sum of all contact percentages (do not forget, they are people) multiplied by their corresponding contact frequency will allow us to obtain the GRPs, the Gross Rating Point or the gross rating of the campaign.
Once the net coverage and the total GRPs are obtained, as they are circular formulas based on three parameters, it is very easy to calculate the average frequency, the OTS (Opportunities to see), the average number of times the contacted people have seen the campaign: it is enough to divide GRPs (gross coverage) by the net coverage. Next, in Table 1, we can observe the data grouped in a distribution of contact frequencies, a descriptive step that will facilitate a later more detailed exploration of results (Almazán, A., Arribas, J M, Mañas, B. Vallejos, A., 2015). To do this, the count of absolute frequencies must be transformed into relative frequencies, that is, into percentages.
Table 1. Distribution of contact frequencies of the campaign (I)
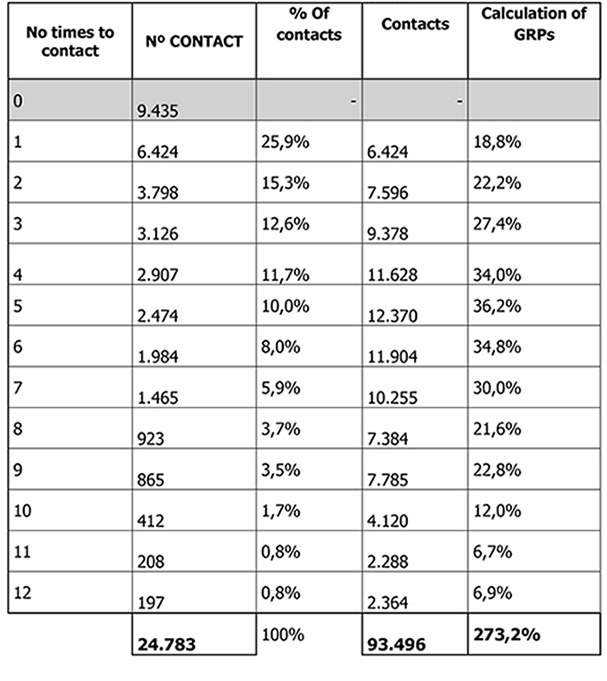
Table 1 is a frequency distribution table because it shows how often, how many times the campaign has been viewed for each level of contact. Its presentation in a table makes the numerical pattern easier to be seen (Aron, Coups, Aron, op. Cit) and therein lies the great usefulness of the distribution, the display, the visual presentation of results that facilitates an accurate reading of data. It should be emphasized that there are similarities between the distribution of frequencies and a camera, which allows us to show both the general photography with a panoramic view and, thanks to the zoom, internal details that are not perceptible in a first reading. In Table 1 we have first calculated the percentage that each frequency stretch represents over the total number of contacted people. Logically, this does not take into account not contacted people because they do not meet the requirement of having been contacted at least once. The percentage of those who have received at least one contact is 25.9%, that of those who have received 2 contacts is 15.3%, ... and so on. The sum of each stretch of contacted people must necessarily add up to 100, since it represents the total to which all the indicated percentages will be referred.
Then, in the column referred to the contacts, when including the duplications, a qualitative leap is produced that is very relevant for the reflection on key concepts, since we are going to go from showing net data (contacted persons) to gross data (contacts). Duplications, while mentally suggesting twice, in professional jargon refer to any possible spectrum of contact frequencies from 2 to n contacts. That is, they are called duplication regardless of whether they are 2, 3, 4, 5, ... or n times the times the contacted person has seen the spot. If you divide each segment of contacts, something like “duplicated people”, by the target group (34,218 people), you get the rating point.
The sum of all rating points of each stretch of contact frequency will allow us to obtain a KPI such as the GRP or Gross Rating Point, an index number that, as its name indicates (Gross), is obtained from the sum of all gross percentages or percentage of contacts with their corresponding duplication. Thus, for a contact frequency at once, there are 6,424 contacts, which are obtained from 6,424 contacts multiplied by their corresponding contact frequency, in this case by 1. If it is divided by the target (remember, 34,218 people ), it results in a rating point of 18.8%. In the case of a contact frequency of two contacts, there are a total of 7,596 contacts: 3,798 contacts multiplied by their contact frequency, in this case 2. The same form is used with each stretch. The sum of all the ratings will allow us to obtain the GRPs, KPI of reference in any media planning to know the advertising pressure and that will allow us to compare it with other campaigns and competitors. The total ratings in the case amount to 273.2 GRPs.
With the net coverage (72.4%) and GRPs (273.2), the average frequency or campaign OTS is easily obtained, since the formulas are circular. The GRPs divided by the coverage give an average frequency of 3.77 in the example. This means that the campaign has been seen almost 4 times on average. This figure can also be obtained in another way if the total number of contacts (93,496) is divided by the total number of contacted people (24,783). The graphical representation of the distribution of contacts and corresponding OTS is detailed in the following Figure 2.
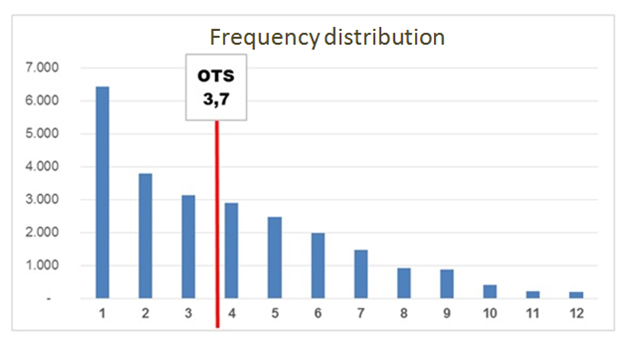
Figure 2. Distribution of contacts and OTS of the campaign. Source: Made by the author
As discussed above, GRPs (273.2), OTS (3.77) and Coverage (72.4%) are the key indicators (KPI) of a media planning. The three, but especially GRPs, summarize the results of the campaign, indicate in a summarized way how many members of the target have been reached by it, their percentage and the average impact frequency, the average number of times they have seen the campaign. They are indicators of the performance of a campaign that condense a lot of information, but precisely because of it, as they concentrate too much, they are clearly insufficient to know the reality of the campaign in depth.
Firstly, referring to OTS, a first reading would be that the campaign has had the opportunity to be seen by the members of the target contacted an average of 3.77 times. But if we look at the data by contact frequencies, we observe the following:
• Those who have been contacted only once account for more than a quarter of contacted people, 25.9%; Compared to the target, they account for 18.7%.
• The sum of those contacted once, twice and three times, all of them below the threshold set by the average campaign frequency (3.77) represent 53.8% of those contacted, and 39% of the target. Half of the coverage is provided by lower frequency levels than the average frequency.
• In this line, and referring to the upper stretches of contact frequency (from 8 to 12), it is observed that the sum of contacts is only one-tenth, 10.5% of contacted people and only 7, 6% of the target.
• Those levels of contact frequency immediately above the average frequency, specifically from 4 to 7 times, represent 35.6% of contacted people and 25.8% of the target.
A first in-depth reading allows us to confirm the richness and depth of data provided by the graph obtained from the data obtained by the frequency distribution. With a minimum disaggregation of the results of the campaign, it allows us to know its reality and to draw very valuable conclusions beyond the generalized tendency marked by OTS and GRPs. It is in the first stretches of contact frequency where the campaign establishes and consolidates coverage figures, more than half with only three impacts. This is logical because the probability of being seen at least once, which strictly constitutes the coverage, is very high in the lower threshold and much reduced in the upper stretches.
The second reading that can be made from the data is referred to the inverse evolution of the coverage and the GRPs. It is at low frequency levels where the campaign gets more coverage. As the frequency increases, obtaining less coverage because they are factors with an inverse correlation, when one grows the other decreases. Only for a one-time contact frequency, of a single contact, the percentage of contacted people exceeds the contacts (25% vs 18%). This is because they are referred to different totals. Respectively a target, which includes not contacted and contacted people, which only includes people who have received at least one contact. From two contacts on, the evolution is reversed, the net coverage decreases progressively and the gross coverage reaches its peak in the stretches of 4 to 7 impacts, just where the average frequency is concentrated (3.77).
Referring to the data in Table 1 and the trend marked by Figure 2, this evolution can be clearly seen in Figure 3, which shows the contrast between contacted people (persons) and contacts (persons multiplied by their level of contact frequency). The graph shows, on the one hand, with a squared filler, the group of people that are grouped for each stretch of contact frequency. On the other hand, with a solid filling, we see these same people multiplied by their contact frequency in each stretch. For example, if you analyze the stretch of three-contact frequency, you can see that there are 3,126 people, 12.6% of coverage, who have seen the spot three times, which, at the contact level, means 9,378 contacts, 27, 4% GRPs. In the graph, the area of contacts is three times the area of contacted people because it graphically represents the group of people multiplied by their contact frequency. The same is true for each stretch of impact frequency.
Another reading that gives very interesting data is obtained by analyzing the two extreme points of the distribution, those who receive only one contact in relation to those who see the campaign many times and receive up to 12 contacts. In the case of those who receive a single contact, the net coverage coincides with the gross coverage, with GRPs. This happens only with a frequency of one. As duplications are added, a factor that generates the gap between contacted people and contacts will be added. In the case of people who have seen the campaign 12 times, they are very few in number, only 197. They contribute very little coverage to the campaign, with less than 1% (0.8%). Their percentage of GRPs (6.9%) is small and disproportionate because it entails counting a small number of people 12 times.
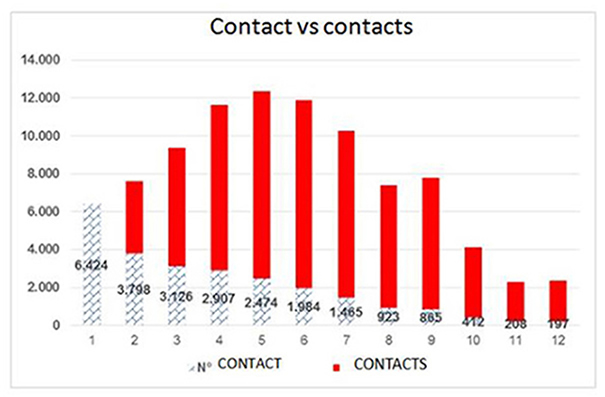
Figure 3. Graphical distribution of contacted people vs contacts. Source: Made by the author
Another complementary view of the data allows us to show the inverse evolution of the coverage and GRPs, which is graphically shown in Figure 4.
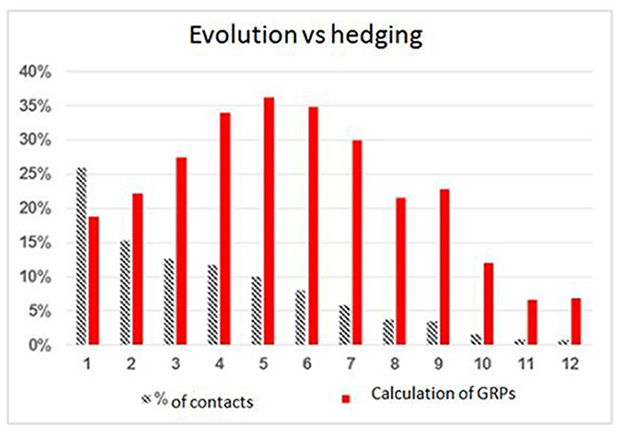
Figure 4. Comparative evolution of coverage and GRPs. Source: Made by the author
In this graph, two columns appear for each stretch of contact frequency. A column, with vertical lines, indicates the net coverage that would be represented by the different people contacted by the campaign of spots. The other column, with a solid color, represents the gross coverage, the GRPs, the contacts with their different levels of duplications. In this case, in addition to confirming the readings made out of Figure 3, it is possible to confirm that, from a certain frequency threshold, a waste of contacts is generated which is counterproductive to the advertising brand. Although it will be analyzed in future research, it is worth noting that the most common way to buy TV spots is at a cost of rating point (C / RP), that is, a negotiated amount is paid for each rating point obtained.
Viewing Figure 4, we perceive the paradox that the advertiser will pay more for the most ineffective frequency thresholds of the campaign, those in which less coverage is obtained and in which GRPs disproportionate to the yields that they offer are generated. The initial levels are the ones that provide greater and more effective coverage. Greater because we reach a large number of people from the target; more effective because the yield obtained from the investment to C / RP is optimal.
5. CONCLUSIONS
The analysis of results of a simple case of media planning has allowed us to show the importance of the information contributed by a distribution of contact frequencies. The advertising market, advertisers, agencies and media, for the sake of transparency and objectivity, should go beyond the usual, useful GRPs and OTS that, although providing a real vision of the results obtained by the campaign, are incomplete and concentrate meanings that require a more leisurely and detailed reading. Including in the campaign reports a distribution of frequencies allows us to show in light and stenographer how the campaign has behaved at each level of contact frequency and to obtain essential insights in relation to present and future planning and to what our competitors do.
It is a very simple tool to obtain, easy to disaggregate with a spreadsheet, which does not require very technical knowledge to interpret the data and that provides an enormous added value for making decisions of great economic importance. From there, it is in the opinion of the brand how to deal with the dilemma, the desirability of planning campaigns by putting emphasis on coverage or frequency, all with the objective of effectively and efficiently transferring this uncertain threshold that separates notoriety from absolute indifference.
6. REFERENCES
1. Almazán A, Arribas JM, Mañas B, Vallejos A (2015). Análisis estadístico para la investigación social. Madrid: Gaceta UNED.
2. Aron A, Coups E, Aron EN (2014). Statistics for the Behavioral and Social Sciences: A Brief Course. Essex: Pearson Education Limited.
3. Beerli A, Martín JD (1999). Técnicas de medición de la eficacia publicitaria. Barcelona: Ariel Economía.
4. Gravetter FJ, Wallnau LB (2014). Essentials of Statistics for the Behavioral Sciences, (8th Edition). Boston: Wadsworth Cengage Learning.
5. Martínez Ramos E (1992). El uso de los medios de comunicación en marketing y publicidad. Madrid: Akal.
6. Parmenter D (2010). Key Performance Indicators. Developing, Implementing, and Using Winning KPIs. New Jersey: Wiley.
7. Sissors JZ, Baron RB (2003). Advertising Media Planning. New York: McGraw Hill.
AUTHORS
Vicente Badenes y Pla
Doctor of Communication. And Master of Research in Communication from the University of Vigo. He holds a bachelor degree in Information Science. Branch of Publicity and Public Relations from the Complutense University of Madrid and Diploma in Sociology by UNED. He is currently Director General of Ingenio Media
(Zertem Group) and teaches at the Faculty of Social Sciences and Communication of the University of Vigo, as Associate Professor. Author of several scientific articles in the area of Marketing, and expert in media planning.
Https://scholar.google.com/citations?user=jifmu8kAAAAJ&hl=en
Aurora García González
Doctor of Public Communication and, currently, Full Professor of Journalism with accreditation for the Staff of Professors, in the Faculty of Social Sciences and Communication of the University of Vigo. She is the Director of the Departmental Communication and IP Section of the Research Group CS1 (ICOM) of the same University. Author of many scientific publications and articles. She teaches the subject "Public Opinion", in the Degree of Publicity and the course "Models of radio: innovations and social uses" in the Master’s course in Research in Communication. https://scholar.google.com/citations?user=NnLvhMgAAAAJ